Google and government websites all quote the average Australian water consumption as 100kL/year. In 2018, though, the average use was only 73kL/year. Most widely available information is 15 years out of date. Your Life Your Planet presents the facts about water and how they are derived.
The Water Account released by the ABS in June 2020 covered the year 2017–2018.
In 2017–18, the total amount of water extracted from the environment was 70,300GL. This was a decrease of 6% from the previous year, primarily because most of the nation was in drought.
Industries extracting water include:
- Electricity and gas supply 53,000GL
- Agriculture 3,381GL
- Mining 1,108GL
- Manufacturing 297GL
The sewage and water supply authorities distributed 11,756GL. This is less than 14,828GL distributed in 2016–17 and much less than the 26,000GL used in many years between 2000 and 2009.
Sectors consuming distributed water include
- Agriculture: 7,327GL, 62%
- Household: 1,790GL, 15%
- Manufacturing: 235GL, 2%
- Electricity and gas supply: 146GL, 1%
- Mining: 102GL, 1%
Most calculations leave out the water self-extracted by electricity and gas supply as that is released back into the environment, and divide up the rest. By that method, the usage of water by each of these sectors is
- Agriculture 65%
- Household 10%
- Mining 7%
- Manufacturing 4%
- Energy supply 1%
These are the percentages used in calculating the contributions by these industries in the text of the book. The missing 13% is used in construction (concrete is included in manufacturing), municipal management (street cleaning, sewage treatment, etc) or lost in the system (including leaks).
The per capita use of water given in the accounts is 610kL/y or 1,671L/d. This is the total water footprint, including the water used by industry on behalf of each of us.
The per capita use of water in the household as presented in these most recent accounts is 199L/d or 73kL/y. Most government websites still use 97L/y or 100kL/y as the average Australian individual consumption. That is based on a 2014 report which combined ABS figures from 2009 and water agency figures from 2012. We use 200L/d as a round number for comparing the impact of particular tips.
The Personal water target refers to the per capita use of water in the household, because that is the number publicised during droughts. The total water footprint is used to consider the impact of food choices on the water footprint of an individual.
Let’s put that into perspective. We each use, on average, 199 litres per day, but our total water footprint is 3,562 litres a day. That is the water used in Australia each day divided by the population.

Of this, 2,494 litres is used in the production of food (30% of which is wasted before it is sold) and 667 litres is used by industry (partly to make things that we use, and partly in inter-industry activity that cannot be attributed to us personally). Of the remaining 401 litres, 127 is used in urban water management, largely processing sewage but also washing streets. There
is leakage in all these activities, usually somewhere between 5% and 20% that is then returned to the environment or lost down the drain.
When we map that onto the Personal water target, we see that our personal impact is reasonably limited.
Water use within the household varies considerably between jurisdictions. We have used figures provided by the Federal government’s yourhome.gov.au to arrive at
- Garden 34%
- Shower 22%
- Toilet 18%
- Laundry 16%
- Kitchen 10%
These calculations are used to explain the impact of each tip as well as inform the text.
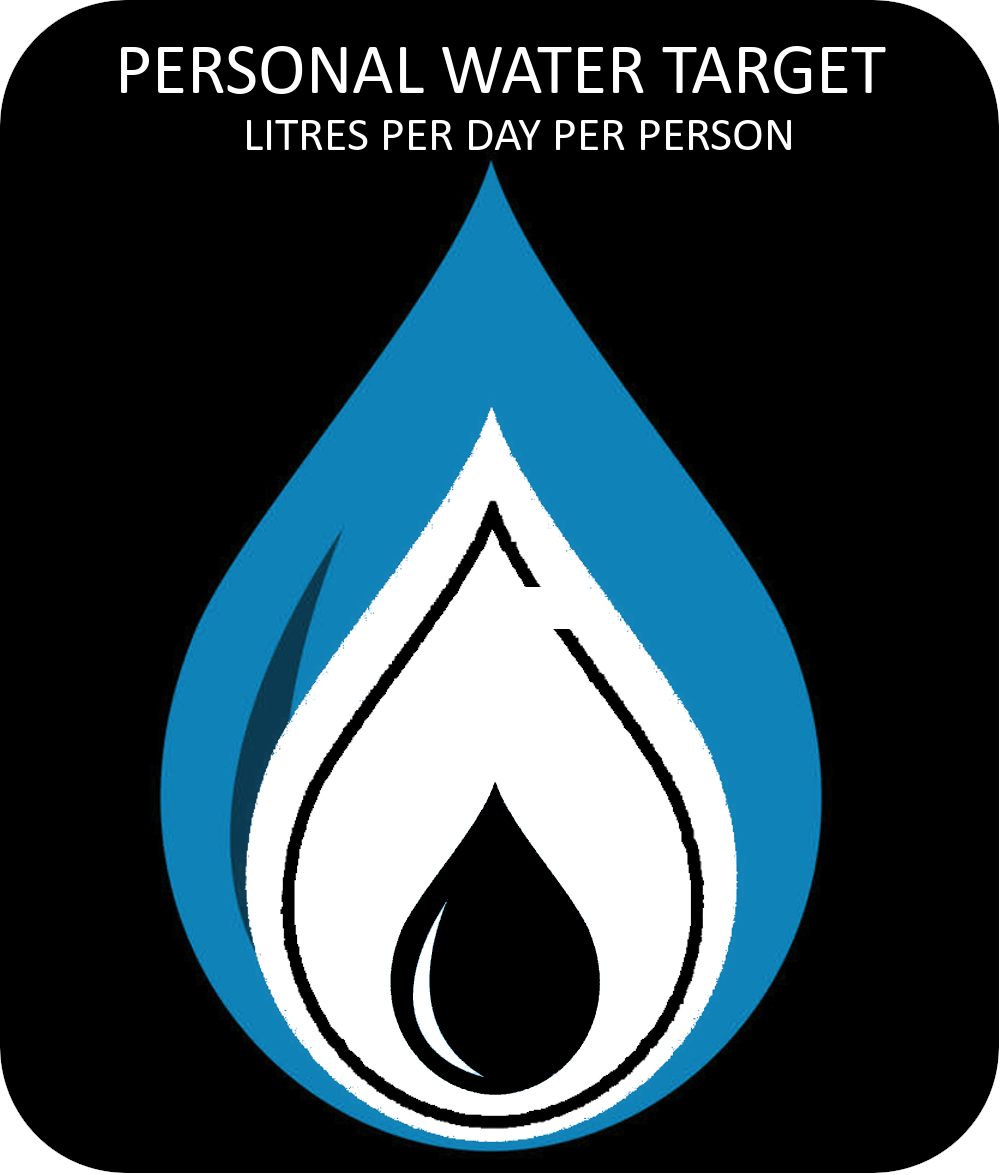
Water is a national, rather than a global, issue. As a result, your Personal
water target is compared to average Australian use.
• The outer area of the target, 360 litres a day, is at the upper end of per
person consumption; it represents someone in an affluent suburb with
a swimming pool in times of no water restrictions.
• The white drop represents the national average of 199 litres per day.
• The target of 144 litres per day is about the middle of the personal targets in cities in 2018.

The town of Stanthorpe in Queensland, for example, had a target of 100 litres per day after its water supply ran dry and water was trucked into town for people to collect in large containers.
As with the carbon target, smaller is better. Again, the savings described in each tip are calculated based on the average household, as defined above.